There
are two sides to monitoring—the manual side and the automatic side.
Obviously, as a busy administrator you want to automate the process as
much as possible. To accomplish that, you have to first determine what
you really need to watch and then manually configure the software to
monitor and report on itself.
Note
Microsoft
uses a methodology called the Microsoft Operations Framework to control
the process it calls lifecycle management. This includes a great deal
of time and planning along with mediation on the cycle and how you can
maintain your infrastructure. Within the plan, Microsoft includes
schedules you can use to help monitor Exchange. Go to the TechNet site
at http://technet.microsoft.com/en-us/library/bb266969(EXCHG.80).aspx
and note that there are daily, weekly, monthly, and as needed tasks to
care for. You can print operations checklists too, or tweak them to
make them your own.
Some of the tools you can use to assist you include the following:
Performance Monitor
Event Viewer
Performance Troubleshooter
Microsoft Operations Manager (MOM 2005)
Systems Center Operations Manager (SCOM)
Let’s consider the use of each one.
Performance Monitor
The
Reliability and Performance Monitor (which is the new tool introduced
to us in Windows Vista, used for performance monitoring in Server 2008)
is still a fine tool for checking out our Exchange situation. However,
there is a Performance Monitor option from within the Toolbox that is
already set up with all the needed objects and counters.
To use the EMC’s preconfigured Performance Monitor, perform the following:
1. | Open the Exchange Management Console (EMC).
|
2. | From the Navigation Tree, select Toolbox.
|
3. | Scroll down to the Performance tools, select Performance Monitor, and then, from the Actions pane, select Open Tool.
|
4. | Here you can see (in Figure 1)
the preconfigured options, some of which are server-oriented, such as
Processor (% Processor Time) and Memory (Pages/sec). Others relate to
the MSExchange Store Interface, the Information Store, the IS Mailbox,
the Transport Queues, and the Transport SMTP Send and Receive.

|
5. | If the screen appears too busy, you can deselect the checkboxes for the counters you do not need.
|
6. | If you want to add new counters, you can click the plus button and choose the objects and counters you need.
|
Later
in this chapter, we discuss what Microsoft is pushing for your Exchange
monitoring tool—MOM 2005. One of the necessary features to any
monitoring tool is the capability to alert an administrator when there
is a problem. That problem can be something as simple as your server
reaching low disk space, and you want to know about it as soon as
possible.
However,
even if you do not have MOM 2005 and don’t intend to purchase it and
use its features in your environment, you can still use Performance
Monitor to alert you to Exchange-oriented issues.
Note
Keep
in mind that the Performance Monitor tool for Server 2003 is different
from Server 2008. With Server 2008, we now have Data Collector Sets,
which you can use to define certain actions and alerts to occur. We
present both methods of configuring the alerts.
Server 2003 Perfmon Alerts
You can create alerts for many different reasons. Here is just one example.
To
place an alert for disk space issues (through either the normal
Performance Monitor or the Exchange Server Performance Monitor) on a
Server 2003 system, perform the following steps:
1. | From within the Monitor tool, locate the option in the navigation pane called Performance Logs and Alerts.
|
2. | Right-click Alerts and choose New Alert Settings.
|
3. | Type in something logical, such as Low Disk, and click OK.
|
4. | There is a Comment field you can use to explain the purpose of your alert.
|
5. | Click the Add button.
|
6. | Choose the Exchange server you want to monitor from the Select Counters from Computer drop-down box.
|
7. | Choose Logical Disk from the Performance Object drop-down, and choose Free Megabytes from the Select Counters From list box.
|
8. | Confirm your choices and click Add. Then click Close.
|
9. | Select
Under from the Alert and type in a number in MB that represents the
amount of disk space you wish to be worried beyond. Perhaps it is 25%,
20%, 15% and so on—figure out the amount that percentage is in relation
to the disk drive and use the MB.
|
10. | Alter the Sample Data Every settings to once per day.
|
11. | Select the Actions tab and select the way you want to be alerted.
|
12. | From the Schedule tab, you can choose the time the alert can run (or set it to be run manually).
|
13. | Click OK.
|
Server 2008 Perfmon Alerts
You can create alerts for many different reasons. Here is just one example.
To
place an alert for disk space issues (through either the normal
Performance Monitor or the Exchange Server Performance Monitor) on a
Server 2008 system, perform the following:
1. | From within the Monitor tool, locate the option in the Navigation pane called Performance Logs and Alerts.
|
2. | Expand out the Performance Logs and Alerts.
|
3. | Expand Data Collector Sets.
|
4. | Select and then right-click User Defined.
|
5. | Choose New and then Data Collector Set to open the wizard.
|
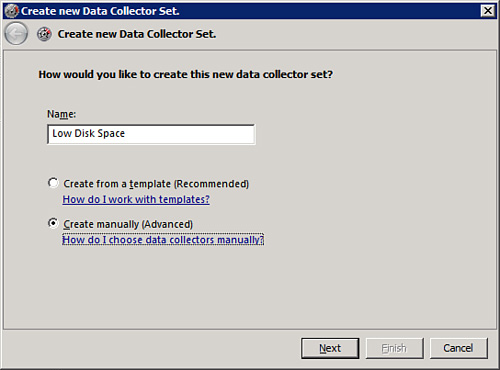
6. | From the opening screen, shown in Figure 2, you can input a name (perhaps Low Disk Space), and then choose Create Manually (Advanced). Click Next.
|
7. | When asked, “What type of data do you want to include?” select the Performance Counter Alert radio option. Then click Next.
|
8. | When asked, “Which performance counters would you like to monitor?” click Add.
|
9. | Choose the Exchange server from the Select Counters From Computer drop-down.
|
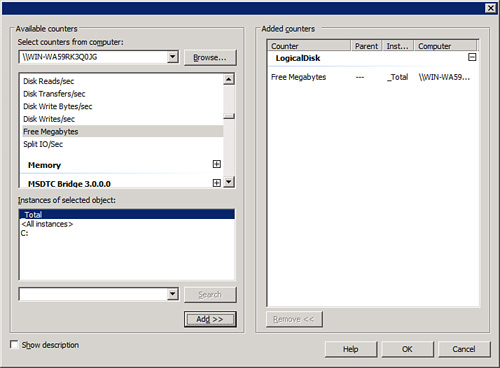
10. | From the Available Counters list, select LogicalDisk.
|
11. | Then
select % Free Space or Free Megabytes as the counter. Choose Add, and
it will be added to the Added Counters section, as shown in Figure 3.
|
12. | |
13. | Then you can choose to alert when above or below a certain limit.
|
14. | Click Next and Finish.
|
15. | To configure the alert you want to occur, select your new Data Collector Set and then click Properties from the Actions pane.
|
16. | On the Alerts tab, you should see the configuration for the collector set already.
|
17. | Select
the Alert Action tab and choose to write an entry to the application
event log. (Note we discuss the Event Viewer in the next section.) You
can also start another Data Collector Set if the alert criteria is met.
|
18. | Select the Alert Task tab to choose a Windows Management Interface (WMI) task and arguments to run if the criteria are met.
|
19. | When you are finished, click Apply, and then click OK.
|